College Bowl Games: Five Bowl Game Betting Angles to Consider
December 27, 2019 – by Jason Lisk
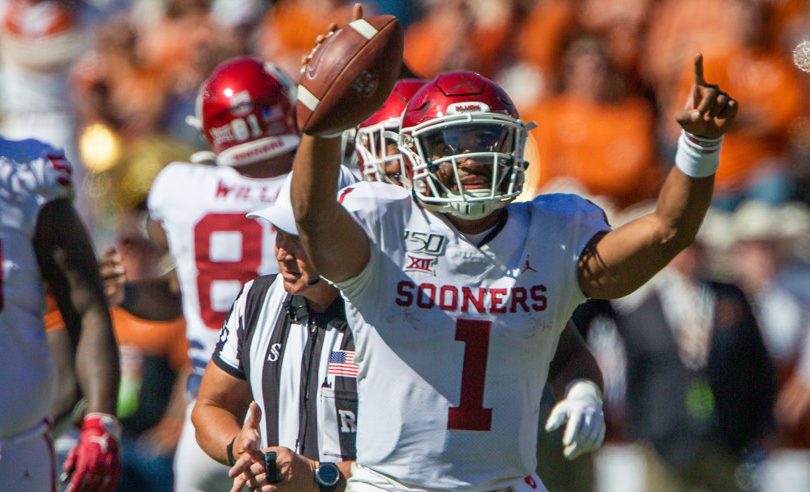
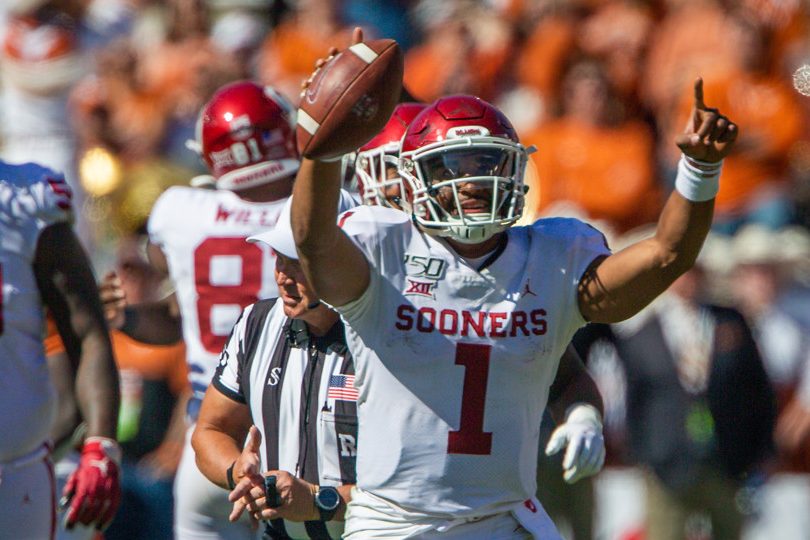
Jalen Hurts wants to remind you that big underdogs have made a big splash in bowl season (Photo by William Purnell/Icon Sportswire)
College Bowl Season is here, along with the excitement and bragging rights that goes with it. It’s also an opportunity for those that like to participate in bowl pools or just have a little skin in the game when there is a game on the television. Today, we are going to focus on some interesting bowl game betting angles to consider as you look at matchups.
We’ll note that some trends have smaller sample sizes, given the nature of looking at around 40 games per year, so you can judge what you think is relevant versus what you think is not. If you want to look through all the bowl results, you can do your own research with our custom trends tool.
You can see all the 2019-2020 bowl game odds here, including point spreads, money lines, and point totals.
NFL Week 1 Picks
Betting – Survivor – Pick’em
Start Free TrialGet The Season
Now to the bowl game betting angles. (All of these are for bowl games played through the 2018-2019 season and do not include any games from this bowl season).
Big Bowl Upsets
Bowl games have a reputation for being unpredictable. Motivations for playing in a game can vary, players can be suspended or sit out the game, and some teams are just more excited to be there.
Does the data support that bowl games have some big upsets? Well, in the games with the biggest point spreads, and longest money line odds for the underdog, the answer is yes.
Two of the four largest underdogs since 2008 have won outright (Oklahoma +613 vs. Alabama, and Texas Tech +644 vs. Arizona State, both in 2013). If you had wagered an equal amount on every bowl game underdog with a money line of +300 or more, you would be up +22.8 units since 2008. Those results come from just 17 wins by big underdogs across 65 games in 11 years.
This is a strategy, though, that will result in a lot of smaller losses in exchange for a few big hits. As the past results show, the favorites have won these games nearly 75% of the time.
Here is every game with a money line of +300 or more in a bowl game from 2008 to 2018:
| Year | Bowl Game | Underdog | Favorite | Spread | O/U Total | Money Line | Result | ATS Result |
|---|---|---|---|---|---|---|---|---|
| 2014 | New Mexico | TX El Paso | Utah State | 10 | 45 | 302 | Loss | No Cover |
| 2018 | Liberty | Oklahoma St | Missouri | 10 | 71.5 | 302 | Win | Cover |
| 2008 | Capital One | Michigan St | Georgia | 9 | 57 | 305 | Loss | No Cover |
| 2011 | Texas | Northwestern | Texas A&M | 9.5 | 69 | 305 | Loss | No Cover |
| 2011 | Poinsettia | LA Tech | TX Christian | 10 | 55.5 | 305 | Loss | Cover |
| 2016 | Holiday | Minnesota | Wash State | 8.5 | 61 | 308 | Win | Cover |
| 2015 | Outback | Northwestern | Tennessee | 9.5 | 48.5 | 308 | Loss | No Cover |
| 2014 | Music City | Notre Dame | LSU | 8.5 | 50.5 | 310 | Win | Cover |
| 2017 | Outback | S Carolina | Michigan | 9 | 41.5 | 310 | Win | Cover |
| 2016 | Military | Wake Forest | Temple | 10.5 | 41.5 | 310 | Win | Cover |
| 2012 | BCS Championship | Notre Dame | Alabama | 10 | 39.5 | 311 | Loss | No Cover |
| 2010 | New Mexico | TX El Paso | BYU | 10.5 | 51 | 314 | Loss | No Cover |
| 2019 | Famous Idaho Potato | Nevada | Ohio | 10 | 62 | 315 | Loss | Cover |
| 2017 | Cotton | USC | Ohio State | 10 | 65 | 321 | Loss | No Cover |
| 2016 | Birmingham | S Carolina | S Florida | 10 | 58 | 321 | Loss | Cover |
| 2012 | Capital One | Nebraska | Georgia | 9.5 | 62 | 322 | Loss | No Cover |
| 2009 | New Mexico | Wyoming | Fresno St | 10 | 54.5 | 326 | Win | Cover |
| 2012 | Famous Idaho Potato | Toledo | Utah State | 10 | 59.5 | 330 | Loss | No Cover |
| 2008 | St. Petersburg | Memphis | S Florida | 10.5 | 57 | 330 | Loss | No Cover |
| 2018 | Cotton | Notre Dame | Clemson | 10.5 | 58 | 330 | Loss | No Cover |
| 2016 | New Mexico | TX-San Ant | New Mexico | 9 | 54 | 336 | Loss | Cover |
| 2016 | Music City | Nebraska | Tennessee | 9.5 | 59 | 336 | Loss | No Cover |
| 2015 | Cotton | Michigan St | Alabama | 10 | 45.5 | 336 | Loss | No Cover |
| 2013 | BCS Championship | Auburn | Florida St | 11.5 | 67 | 336 | Loss | Cover |
| 2008 | Sugar | Utah | Alabama | 9.5 | 45 | 340 | Win | Cover |
| 2008 | Emerald | Miami (FL) | California | 10 | 50.5 | 340 | Loss | Cover |
| 2016 | Heart of Dallas | North Texas | Army | 10.5 | 47 | 340 | Loss | Cover |
| 2009 | Sun | Stanford | Oklahoma | 10 | 53.5 | 346 | Loss | Cover |
| 2018 | Famous Idaho Potato | W Michigan | BYU | 10 | 52 | 346 | Loss | No Cover |
| 2008 | Rose | Penn State | USC | 10 | 44.5 | 355 | Loss | No Cover |
| 2010 | Holiday | Washington | Nebraska | 11.5 | 54.5 | 358 | Win | Cover |
| 2009 | Hawaii | S Methodist | Nevada | 10.5 | 69.5 | 361 | Win | Cover |
| 2017 | Peach | Central FL | Auburn | 10.5 | 66 | 367 | Win | Cover |
| 2009 | Sugar | Cincinnati | Florida | 12 | 59.5 | 377 | Loss | No Cover |
| 2019 | Motor City | Eastern Michigan | Pittsburgh | 12 | 50.5 | 380 | Loss | Cover |
| 2019 | Peach | Oklahoma | LSU | 12.5 | 75 | 385 | Loss | No Cover |
| 2012 | Fight Hunger | Navy | Arizona St | 13 | 54.5 | 385 | Loss | No Cover |
| 2017 | Independence | S Mississippi | Florida St | 13 | 48.5 | 393 | Loss | No Cover |
| 2016 | Peach | Washington | Alabama | 12.5 | 50.5 | 396 | Loss | No Cover |
| 2012 | Texas | Minnesota | Texas Tech | 13 | 55 | 400 | Loss | Cover |
| 2013 | Chick-Fil-A | Duke | Texas A&M | 13.5 | 75.5 | 403 | Loss | Cover |
| 2015 | Liberty | Kansas St | Arkansas | 13.5 | 56.5 | 418 | Loss | No Cover |
| 2015 | Independence | Tulsa | VA Tech | 14 | 62 | 422 | Loss | Cover |
| 2012 | Hawaii | S Methodist | Fresno St | 13 | 62.5 | 423 | Win | Cover |
| 2011 | Insight | Iowa | Oklahoma | 13.5 | 58 | 431 | Loss | No Cover |
| 2011 | Maaco Las Vegas | Arizona St | Boise State | 14 | 65 | 439 | Loss | No Cover |
| 2016 | St. Petersburg | Miami (OH) | Miss State | 14.5 | 57.5 | 439 | Loss | Cover |
| 2019 | Gasparilla | Marshall | Central Florida | 15.5 | 59.5 | 440 | Loss | No Cover |
| 2008 | Alamo | Northwestern | Missouri | 14 | 66 | 445 | Loss | Cover |
| 2018 | Sugar | Texas | Georgia | 12.5 | 59.5 | 450 | Win | Cover |
| 2012 | Sugar | Louisville | Florida | 14 | 47 | 454 | Win | Cover |
| 2014 | Foster Farms | Maryland | Stanford | 14 | 44.5 | 457 | Loss | No Cover |
| 2012 | Orange | N Illinois | Florida St | 14.5 | 58 | 461 | Loss | No Cover |
| 2016 | Miami Beach | Central Mich | Tulsa | 13 | 67.5 | 464 | Loss | No Cover |
| 2013 | Beef’O’Brady’s | Ohio | E Carolina | 14.5 | 63 | 471 | Loss | No Cover |
| 2013 | Alamo | Texas | Oregon | 14.5 | 67 | 481 | Loss | No Cover |
| 2016 | Famous Idaho Potato | Idaho | Colorado St | 16 | 64.5 | 481 | Win | Cover |
| 2013 | Pinstripe | Rutgers | Notre Dame | 14.5 | 53 | 519 | Loss | Cover |
| 2016 | Arizona | S Alabama | Air Force | 14.5 | 54 | 519 | Loss | No Cover |
| 2013 | Fiesta | Central FL | Baylor | 17 | 74 | 519 | Win | Cover |
| 2019 | LendingTree | Miami-OH | Louisiana | 16 | 55 | 525 | Loss | Cover |
| 2019 | Orange | Virginia | Florida | 16.5 | 55 | 525 | Loss | Cover |
| 2018 | Orange | Oklahoma | Alabama | 14.5 | 80.5 | 526 | Loss | Cover |
| 2010 | Fiesta | Connecticut | Oklahoma | 14.5 | 53.5 | 548 | Loss | No Cover |
| 2010 | Maaco Las Vegas | Utah | Boise State | 15.5 | 57 | 562 | Loss | No Cover |
| 2013 | Sugar | Oklahoma | Alabama | 17 | 51.5 | 613 | Win | Cover |
| 2019 | New Orleans | UAB | Appalachian State | 17 | 48 | 625 | Loss | Cover |
| 2013 | Holiday | Texas Tech | Arizona St | 17 | 72 | 644 | Win | Cover |
| 2012 | Heart of Dallas | Purdue | Oklahoma St | 18 | 68 | 671 | Loss | No Cover |
| 2017 | Boca Raton | Akron | Fla Atlantic | 23 | 65 | 1211 | Loss | No Cover |
Goodbye, Coach
Is there any disadvantage when a coach leaves a program (either by taking a new job or getting fired) before a bowl game is played? The evidence suggests that there is no such systematic disadvantage. Or at least, to the extent it exists, it is accounted for in the point spread.
Going back over the last decade, there have been 46 times prior to this season that a coach left a program and the school had a different head coach for a bowl game than they had all season. The teams playing with a different head coach are 26-20 straight up, and 25-20-1 against the spread.
That’s not enough for us to say that you should actively play on a team with a new coach. It does suggest, though, that you should not freak out too much and lean against a team because they have a different coach. Every case is different.
Bad Bowl Game Rebounds
Bowl games feature blowouts, upsets, and some crazy results. But what happens a year later in a bowl game after a team was on the receiving end of a beat down or suffered a humiliating upset as a big favorite?
Since 2008, there have been 70 teams who have (1) lost a bowl game and failed to cover the spread by at least 17 points, and (2) returned to a bowl game the following season.
After removing the six matchups between two teams that both qualified, we are left with 58 teams. Those teams are 33-25 against the spread (56.9%) over that span. The rationale behind such an effect is that the players (and coaches) remember how the most recent bowl game went, and a team that suffered some humiliation may be more motivated in their bowl preparation a year later.
Over the last three years, such teams are on a scorching hot 18-4 run against the spread. (Of course, that means that before the last three years, these teams had a losing record against the spread, so the evidence that this trend is meaningful is not clear).
Underdogs who struggled the previous year perform better than favorites have. (Though we will note the sample sizes become even smaller). Underdogs who meet the criteria are 18-10 straight up and 18-9-1 against the spread since 2008. If you had wagered the money line on all underdogs who failed to cover the spread in the previous year’s bowl game by at least 17 points, you would be up +24.8 units in 28 games since 2008.
Underdogs this bowl season who failed to cover last year’s bowl game by at least 17 points include:
Western Michigan, +3.5 vs. Western Kentucky (Lost to BYU 49-18 in 2018 as 10-point dog)Michigan, +7 vs. Alabama (Lost to Florida 15-41 in 2018 as 4-point favorite)Temple, +4.5 vs. North Carolina (Lost to Duke 27-56 in 2018 as 3-point favorite)
Cold Weather Bowl Games are for the Dogs (and Overs)
Traditionally, college bowl games were played in warmer weather venues (compared to the rest of the country in winter). With the expansion of bowl games, though, we have seen a greater variety of locations start to host games. There is now a bowl game in Boise, Idaho and in New York City, for example.
Using data from Weather Spark, we pulled the average daily high temperature on January 1st in each of the bowl host cities. (Bowl games played in a dome were denoted as such as well). Then, we compared the spread and over/under results since 2008 based on the typical climate in the host cities in bowl season.
| SU | ATS | TOTAL | |||||||||
|---|---|---|---|---|---|---|---|---|---|---|---|
| TEMPERATURE | W | L | WIN PCT | W | L | T | WIN PCT | O | U | N | OVER PCT |
| 50 degrees and under | 36 | 28 | 0.563 | 26 | 37 | 1 | 0.414 | 41 | 23 | 0 | 0.641 |
| 51 to 60 degrees | 72 | 32 | 0.692 | 52 | 50 | 2 | 0.510 | 51 | 50 | 3 | 0.505 |
| 61 to 70 degrees | 42 | 26 | 0.618 | 32 | 36 | 0 | 0.471 | 26 | 42 | 0 | 0.382 |
| 71 degrees and above | 52 | 31 | 0.627 | 44 | 38 | 1 | 0.536 | 37 | 45 | 1 | 0.452 |
| Dome Games | 46 | 35 | 0.568 | 38 | 41 | 2 | 0.481 | 38 | 43 | 0 | 0.469 |
| OVERALL | 248 | 152 | 0.620 | 192 | 202 | 6 | 0.488 | 193 | 203 | 4 | 0.488 |
The cold weather venues (those with an average January 1st daily high of 50 degrees or lower) have resulted in more underdog covers and point totals going over the number compared to other bowl games. Underdogs have covered in 58.6% of the bowl games since 2008 at a colder venue. The point total has gone “over” in 64.1% of such games.
The coldest venues currently hosting a bowl game are:
Boise, Idaho (Famous Idaho Potato Bowl), 36 degreesBronx, New York (Pinstripe Bowl), 41 degreesAnnapolis, Maryland (Military Bowl), 45 degreesAlbuquerque, New Mexico (New Mexico Bowl), 47 degreesNashville, Tennessee (Music City Bowl), 49 degreesMemphis, Tennessee (Liberty Bowl), 50 degrees
Only four bowl games have featured at least 8 “Overs” in the last 11 years. Three of those bowl games with the highest “over” rates since 2008 are among the four coldest venues for bowl games, and two of them are the only bowl games played at high elevation. (The other is the New Orleans Bowl, which has gone over in 8 of the last 11 bowl games).
In games played at average temperatures above 60 degrees, meanwhile, the games have gone “under” the total 57.9% of the time since 2008. That includes every outdoor game played in Florida, Arizona, and Southern California, as well as the Hawaii and Bahamas Bowl.
Home Cooking?
If we count teams as playing at home if they are in the same metropolitan area as the bowl game (even if not played at the venue they play the majority of their true home games in the regular season), then teams that get to stay at home are 12-13 straight up and 12-13 against the spread since 2008.
That is to say, it seems as though the betting market properly prices the impact of teams in these situations.
Expand out, though, and there is some evidence that teams with a regional proximity edge can provide value.
We divided every bowl team since 2008 into four categories:
(1) playing in home metro area,(2) playing in home state,(3) playing in a state that neighbors their own home state, and(4) all others.
Teams that get to play in their home state, when playing against an opponent who is not from the same state or a neighboring state, are 52-37 straight up, and 46-41-1 ATS (52.8%).
Teams that get to play in a neighboring state, playing against an opponent not from that state or a neighboring state, are 56-39 straight up, and 50-44-1 ATS (53.2%).
Both of those situations are just above the 52.4% cutline for profitability (if we assume 10% vigorish). But let’s isolate it to underdogs who get to play near home, against opponents coming from further away.
Underdogs who are from the same state or a neighboring state to where the bowl game is played, when playing favorites who do not meet that criteria, are 32-34 straight up, and 38-26-2 ATS (59.1%). Despite being the betting underdogs, they have won nearly as many games as they have lost since 2008.
If you liked this post, please share it. Thank you! Twitter Facebook
NFL Football Pool Picks NFL Survivor Pool Picks NCAA Bracket Picks College Bowl Pool Picks College Football Pool Picks NFL Picks NBA Picks MLB Picks College Football Picks College Basketball Picks NFL Predictions NBA Predictions MLB Predictions College Football Predictions College Basketball Predictions NFL Spread Picks NBA Spread Picks MLB Spread Picks College Football Spread Picks College Basketball Spread Picks NFL Rankings NBA Rankings MLB Rankings College Football Rankings College Basketball Rankings NFL Stats NBA Stats MLB Stats College Football Stats College Basketball Stats NFL Odds NBA Odds MLB Odds College Football Odds College Basketball Odds A product ofTeamRankings BlogAboutTeamJobsContact
© 2005-2024 Team Rankings, LLC. All Rights Reserved. Statistical data provided by Gracenote.
TeamRankings.com is not affiliated with the National Collegiate Athletic Association (NCAA®) or March Madness Athletic Association, neither of which has supplied, reviewed, approved or endorsed the material on this site. TeamRankings.com is solely responsible for this site but makes no guarantee about the accuracy or completeness of the information herein.
Terms of ServicePrivacy Policy